1. INTRODUCTION
Traditional approaches to online opinion research can be problematic. In terms of qualitative research, discussion forums that present comments in lists do not scale well for large groups of people. Not only do they lead to information overload, they also have trouble ensuring that all comments receive equal attention (Faridani, Bitton, Ryokai, & Goldberg, 2010). Regarding quantitative research, online surveys have scalability, but they can often be tedious for participants to complete. Worse still, because there is no interaction between participants in a survey, an opportunity is being missed to capture Social Collective Intelligence. This is a form of insight that emerges “where social processes between humans are being leveraged and enhanced, by means of advanced Information and Communication Technologies.” (Miorandi, Rovastos, Stewart, Maltese & Nijholt, 2014 p. v).
In order to solve some of the problems associated with conventional surveys and discussion forums, we present Crowdoscope: a visual and interactive opinion research tool for obtaining the Social Collective Intelligence of large groups of people. Incorporating ideas from deliberative polling, collaborative filtering and data visualisation as a user interface, Crowdoscope is a self-organising visual environment that can support an unlimited number of participants.
The system represents conversations as interactive visualisations. This not only provides a more engaging experience, it also increases the exposure of participants to diverse perspectives, as well as equalising the distribution of comments for evaluation by the community. From the participant’s perspective, rather than open-ended survey responses disappearing into a black hole, participants have the ability to be heard in an open forum, receive individual feedback and see what comments and themes are resonating with the community.
1.1 Information Overload
Typical discussion forums and comment systems that present comments in lists are often difficult to navigate. As the number of comments in a discussion thread increases, presenting these in a chronological list is not a scalable interface for browsing and skimming (Faridani et al. 2010). This can often result in information overload. When participants are made responsible for handling a heavy information load, they will generally be less able to absorb this information effectively (Schick, Gorden, & Haka, 1990). In developing Crowdoscope, we have sought to create a tool which minimises information overload by sampling comments and presenting them to participants in visual form.
1.2 Data Visualisation as a User Interface
An effective visualisation is often a much more efficient way of conveying information as it can enhance the capability of the people processing it (Larkin & Simon, 1987). Furthermore, visualisations take advantage of our brain’s natural processing ability, which lends itself towards identifying patterns (Illinsky & Steele, 2011). Research also suggests that people participating in a crowd environment will only do so effectively if the interface guides them in usable and meaningful ways (Bigham, Bernstein & Adar, 2014). Therefore, in Crowdoscope, conversations are represented as interactive data visualisations. These visualisations aim to bring the survey to life and enhance the participant experience.
1.3 Diversity of Opinion
An additional issue with contemporary discussion forums and comment systems is that whilst a diverse range of opinions are likely being expressed, not all of these will be heard. The views of thoughtful moderates can often be drowned out by those with considerably stronger opinions (Faridani et al. 2010). To counteract this, Crowdoscope samples responses to ensure that all comments receive roughly equal attention, which also exposes participants to a diversity of perspectives. As a consequence, this can help reduce polarisation – an issue which arises when people’s opinions are shaped by only reading the views of those with a similar opinion (Sustein, 2007). This is similar to confirmation bias: The tendency to search for, or focus on, information in a way that confirms one’s preconceptions.
2. HOW IT WORKS
2.1 The Participant’s Perspective
Each participant progresses through three steps which are outlined below. Figure 1 illustrates the user interface from the participant’s perspective in Step Three.
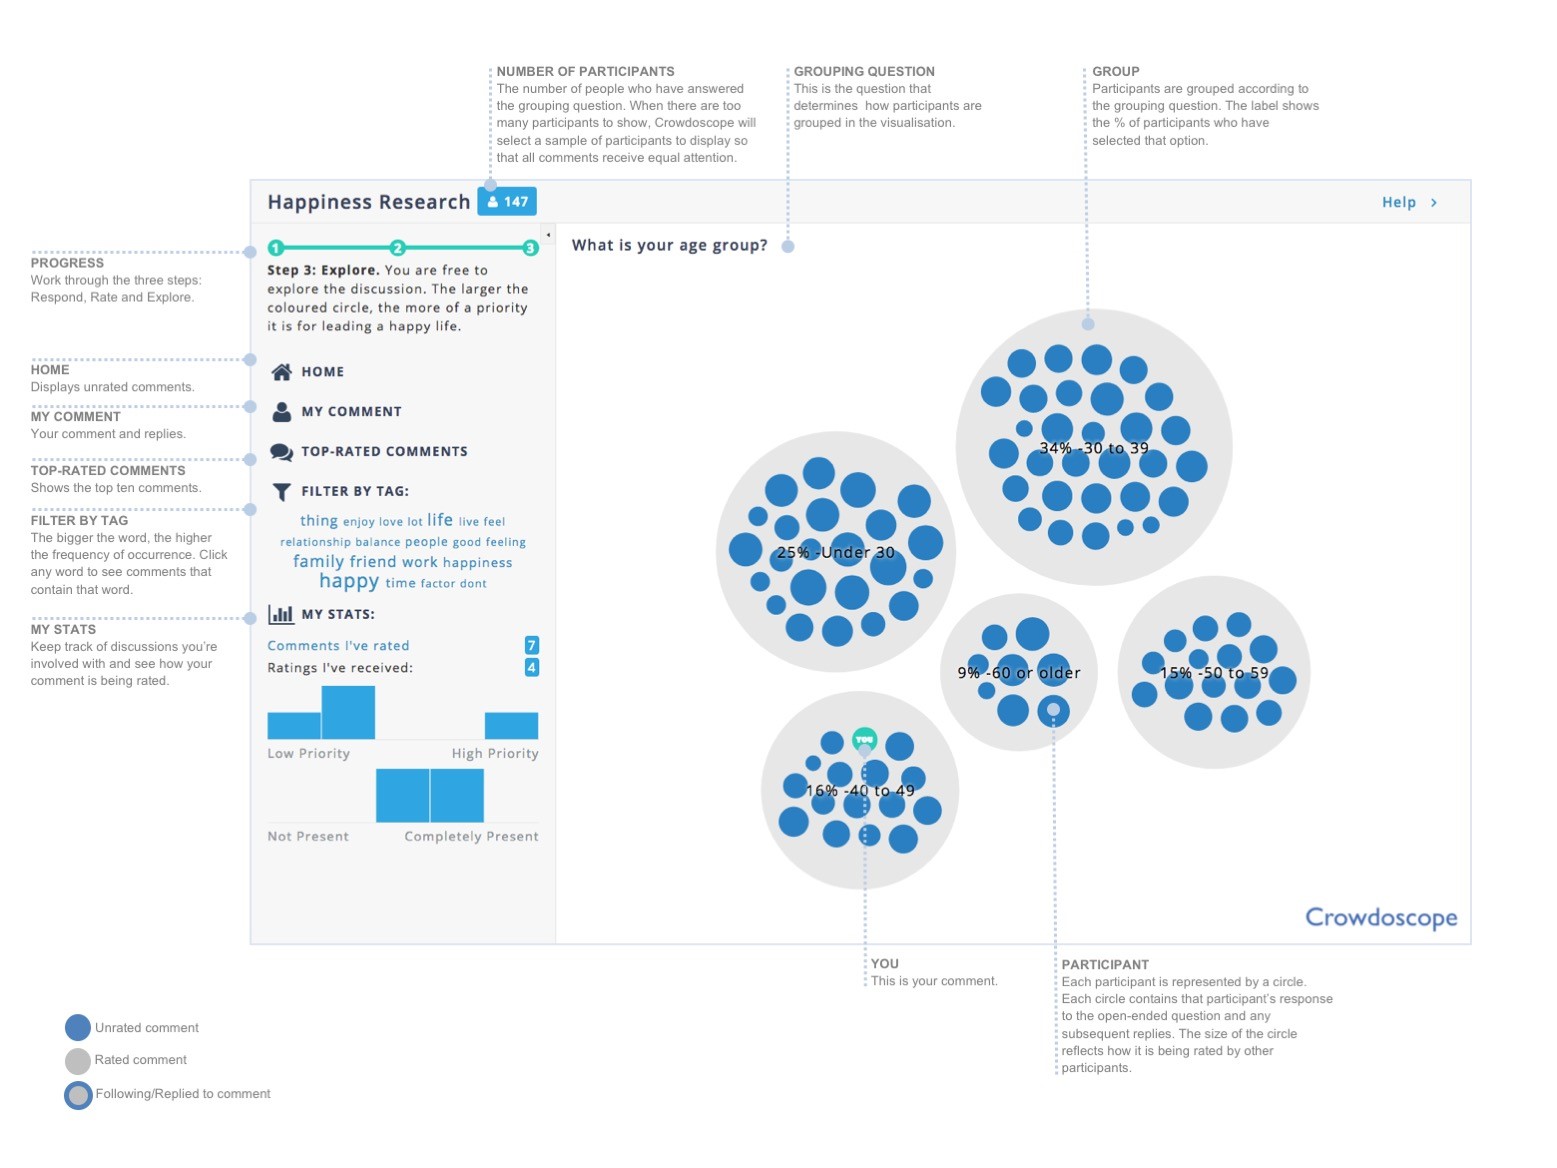
Step One: Respond. Participants respond to a simple survey consisting of one multiple-choice question and one open-ended question. Participants must answer both questions to proceed.
Step Two: Rate. In the second step, two things happen. Firstly, a data visualisation consisting of nested circles shows the overall scores on the multiple-choice question (as a percentage of the total participants – shown as grey circles). Secondly, Crowdoscope displays a sample of comments from other participants (shown as blue circles) that must be rated in order to progress. The project creator determines the number of comments that a participant must rate in this step. The comments shown are sampled according to the number of times each comment has already been rated. In this way, the system ensures that all comments receive roughly an equal amount of attention. Crowdoscope uses a Zooming User Interface (ZUI) which means that participants can change the scale of the viewed area in order to read comments and evaluate them. Comments are rated according to two evaluation questions, the responses to which are captured on a visual analogue scale (slider). Using this method of evaluation ensures the evaluations provided are more insightful than a simple ‘like’ feature. This is because a single binary rating mechanism cannot provide any indication of the evaluation criteria people are actually using when evaluating a comment.
Step Three: Explore. In the third step, participants are presented with a visual discussion forum where they can explore the conversation. The system starts to sample comments when the participant count reaches 100 to prevent information overload. By clicking on the coloured circles, participants can read, rate and reply to comments. Participants are also provided with a control panel to help navigate through the conversation more easily (see Figure 1).
2.2 The Researcher’s Perspective
Participants’ ratings of other participants’ comments form the basis for the Social Collective Intelligence elicited through Crowdoscope. The system uses the ratings obtained from the two evaluation questions to automatically identify the comments that resonate most with the community. In this way, the best comments and suggestions bubble to the surface.
In addition to automatically ranking participants’ input, comments can also be grouped into topics based on the various themes uncovered within individual posts. Once topics have been identified, there are various metrics that can be used to provide an understanding of how important each of these topics are. These metrics can include (but are not limited to) how people are rating the topics according to each of the evaluation criteria and the attitudes held by people who are mentioning a particular topic (eg whether people are satisfied or dissatisfied).
3 USE CASES
Crowdoscope is being used for a variety of purposes, although most use cases come from an organisational context. Many organisations have become too reliant on employee surveys and have ended up suffering from survey fatigue as a result. People can become disengaged with the process which in turn affects response rates to traditional surveys (Conlon, Lane & Harms, 2017). This has resulted in a heightened demand for more insightful and engaging research tools that allow for greater collaboration and knowledge sharing amongst employees. As such, Crowdoscope is being utilised by organisations to gather inputs from their people for collective decision-making on a range of topics, from organisational strategy and transformation to culture change and diversity. The system has also been used successfully to crowdsource insights from audiences at live events and conferences in order to quickly explore emerging issues.
REFERENCES
Bigham, J.P., Bernstein, M.S & Adar, E. (2015). Human-computer interaction and collective intelligence. Handbook of Collective Intelligence, 57.
Conlon, G., Lane, M. & Harms, A. (2017) Review of the Employer Skills and Employer Perspectives Surveys: A synthesis of stakeholder views, DfE research report no. DFE-RR692, Department for Education, 1-42, Available: https://www.gov.uk/government/publications/employer-skills-and-employer-perspectives-surveys-review [17 February 2018].
Faridani, S., Bitton, E., Ryokai, K., & Goldberg, K. (2010) Opinion Space: a scalable tool for browsing online responses. In Proceedings of the 28th international conference on human factors in computing systems, ACM, 1175–1184.
Illinsky, N & Steele, J. (2011) Designing Data Visualisations: Representing Informational Relationships, O’Reilly Media, 1-114 .
Larkin, J. H. & Simon, H. A. (1987) Why a Diagram is (Sometimes) Worth Ten Thousand Words.
Cognitive Science, (11)1: 65–100.
Miorandi, D., Rovastos, M., Stewart, J., Maltese, V., Nijholt, A. (eds.) (2014) Social Collective Intelligence: Combining the Powers of Humans and Machines to Build a Smarter Society. Cham. Springer.
Schick, A. G., Gorden, L. A., & Haka, S. (1990). Information overload: A temporal approach. Accounting Organizations and Society, 15: 199-220.
Sunstein, C. (2007). The Law of Group Polarization, The Journal of Political Philosophy 10(2): 175-195.
